Previous Month | RSS/XML | Current | Next Month
WEBLOG
January 21st, 2017 (Permalink)
Book Club: Winning Arguments, Introduction
Let's start this year off right with a book club! For those who don't know, a book club is where I will read a book, usually at the rate of a chapter a month, and write a commentary on that chapter. Hopefully, at least some of you will read along, otherwise it's going to be a small club.
I've chosen last month's "New Book" Winning Arguments by Stanley Fish1 to read. It has some desirable qualities: First of all, it's short―there are only six chapters and an introduction of a few pages―so no one has to commit themselves to any heavy lifting. Secondly, based on past familiarity with Fish's work, I expect to disagree with at least some of it. This is important because if I agreed with it too much I wouldn't have anything to say other than "yes", "that's right", "I agree", etc., which gets tedious.
Let's start things off this month with the introduction, which is only two and a half pages long. It's available to be read online at the publisher's website2, so you can get started now even if you don't have a copy of the book. However, for later installments of the club, you'll need to get your own copy if you want to read along.
I think you'll get the most out of these entries if you first read the chapter for the month and then read my commentary on it―my comments may not make much sense to you if you haven't read the chapter. So, for this month, please go read the introduction then come back.
The full title of the introduction is: "Introduction, or What This Book Promises to Do", so it should tell us what we can expect to learn from the book, and what we should complain about if it doesn't deliver.
Fish starts by saying that he aims to do two things that might seem to be incompatible but are not:
- Explain the effect of context on argumentation.
- Make the case that argumentation is unavoidable and never-ending.
At this point, you might well wonder what this has to do with winning arguments―the title of the book―and what works and doesn't work in politics, the bedroom, the courtroom, and the classroom―the subtitle. The connection may be marketing. The titles and subtitles of books are often supplied by the publisher rather than the author, so it's possible that Harper-Collins thought that a book titled "Winning Arguments" would sell better than one entitled "The Context of Argumentation" or "The Inevitability of Argument".
However, the first of Fish's promises plausibly has some bearing on the "winning" of arguments, namely, context. Fish writes:
Say you're a politician, and you want to persuade people to vote for you. What kind of arguments can you make and what arguments might you do better to avoid? … Or say you find yourself in court. What arguments will a judge allow you to make and what arguments will be ruled inadmissible…? Or suppose you are a college teacher eager to advance in the profession by making arguments that will be compelling to your peers. … These are questions with answers, and you will find them in the pages that follow.3
In other words, context has an effect upon the effectiveness of argumentation. This certainly seems correct, but Fish is promising a lot if he's going to tell us in one slim book how to argue in politics, the law, the academic conference, etc. There are whole books on political and legal argumentation. So, this is an ambitious goal; let's remember it so that we can hold Fish to it.
In contrast, it's hard to see how achieving Fish's second aim would contribute to winning arguments. Rather, it's the sort of preliminary argument you might make if you wanted to convince a skeptical reader that this is a subject worth pursuing. If, as Fish claims, we cannot avoid argument or bring it to an end, then we'd better learn how to do it as well as we can. I would expect such an argument to occur in the introduction, rather than the body, of the book. Instead, all that we get here is a rather unclear statement of Fish's position, not an argument for it. However, it appears that this is one of the things we should expect him to argue for over the course of the book.
Here's a question to think about: if argumentation is interminable, how is it possible to "win"? In a game such as chess, an unending game would count as a draw. If we can never reach a final conclusion that everyone will admit, how can anyone claim to have "won"? Is this what Fish was alluding to when he wrote: "This book tries to do two things that might seem to pull against each other, but in the end I don't think they do." In other words, achieving the second goal seems to undermine the possibility of achieving the first. How does Fish resolve the seeming incompatibility of his aims?
Finally, consider the following passage:
Each of us occupies a partial, time-bound perspective and none of us has access to the God's-eye view from which the "big picture" might be seen at a glance. Therefore any statement any of us makes is an argument because, as an assertion that proceeds from an angle, it can always be, and almost always will be, challenged by those whose vision is also angled, but differently so.4
This is an argument in the logician's sense of "argument", that is, a group of claims, one of which is supposed to follow from the others. Now is a good time to review how to recognize the structure of arguments if we want to be able to understand and evaluate Fish's arguments. For this purpose, I recommend the lesson on argument analysis from almost ten years ago5, but almost any introductory textbook on logic will serve.
I will leave it as an exercise for the reader to determine the structure of Fish's argument; see the next installment to check your answer.
Sources & Resources:
- New Book: Winning Arguments, 12/22/2016.
- Stanley Fish, "Introduction", Winning Arguments
- Pages 1-2 in the hardcover edition.
- Page 2 in the hardcover edition.
- Lesson in Logic 7: Argument Analysis, 7/31/2007. Also see previous lessons if this one isn't understandable on its own.
Next Month: Chapter 1. Living in a World of Argument
January 18th, 2017 (Permalink)
Using Venn Diagrams to Solve Puzzles
Take a break this month from the lessons in logic and learn how to use Venn diagrams to solve some types of puzzles. Of course, you can use such diagrams to solve logic puzzles based on categorical syllogisms or other types of reasoning with categorical statements―I've posted a few puzzles of that type here. What I have in mind now is a different type of puzzle that uses numbers or percentages, which means that it's not the sort of puzzle you might think of using a Venn diagram to solve. Here's an example:
A poll of British tea drinkers found that half take their tea with milk, only 15% drink it straight, but 60% do not use sugar. What percentage use both sugar and milk?
Now, you can solve this type of puzzle algebraically, but I think it's easier and more intuitive to use a diagram. Let's see whether you agree with me.
Here's how. If you consider the universe of this puzzle to be British tea drinkers, there are two classes involved: those who put milk in their tea and those who use sugar. There are, of course, subclasses mentioned, such as those who use neither milk nor sugar, and the question that you are asked is about one such subclass: those who take both sugar and milk. These are the subclasses determined by a two-circle Venn diagram. Here's how to solve such a puzzle using such a diagram. The first step is, of course, to set up the diagram, labelling the circles "Milk" and "Sugar", so:
The puzzle gives you three pieces of information:
- 50% of the tea drinkers use milk.
- 15% use neither milk nor sugar.
- 60% don't use sugar.
You can't use clues 1 or 3 to start with, since you only know generally where the percentages belong. For instance, the first clue tells you that half of the tea drinkers are contained in the "Milk" circle, but you don't yet know what percentage is in the left-hand crescent-shaped section, and what in the lens-shaped overlap section. However, the second clue tells you that 15% of the tea drinkers are outside of either of the two circles, so add this information to the diagram by writing "15%" in the space outside of both circles, like so:
From the first clue, you know that half of tea drinkers do not use milk, of which 15% drink tea straight. This means that 50-15=35% use only sugar. The part of the diagram that represents the subclass of those who use only sugar is the right-hand crescent. Add this information to the diagram:
Now, from clue 3 you know that 60% don't use sugar, and those who use neither milk nor sugar are a subclass of those who don't use sugar. The other part of the class of those who don't use sugar are those who take only milk, so that subclass must contain 60-15=45% of the tea drinkers. The subclass of those who take only milk is represented by the left crescent area of the diagram, so add the information you have just gained:
You've used up all three clues and you're almost done! The only part of the diagram that is unmarked is the part you need to know about, namely, those who put both milk and sugar in their tea, which is represented by the lens-shaped area in the middle of the diagram. So, 100-45-35-15=5% of the tea drinkers use both milk and sugar. Add this information to the puzzle and you're finished:
So, the answer to the puzzle is: 5%. Wasn't that easy?
Here's another one to practice on:
Half of incoming freshman students at Midwestern College do not take logic, but 43% take philosophy. 76% take either philosophy or logic. What percentage of incoming freshmen take logic but not philosophy?
January 16th, 2017 (Permalink)
New Book: How to Win an Argument
Cassius: Did Cicero say any thing?Casca: Ay, he spoke Greek.
Cassius: To what effect?
Casca: Nay, an I tell you that, Ill ne'er look you i' the face again: but those that understood him smiled at one another and shook their heads; but, for mine own part, it was Greek to me.5
Last month's new book was one on winning arguments called―what else?―Winning Arguments1. I pointed out then that this is a perennially popular topic for books, since everyone wants to "win" arguments, whatever that means. As evidence for my claim, I pointed out that there are five different books in The Fallacy Files library on how to win an argument, including Michael Gilbert's aptly titled How to Win an Argument. This month we have yet another book of that name! So, for those of you keeping score at home, that makes at least seven how-to books on winning arguments.
This new book is authored by a very old author―in fact, a very dead one―Marcus Tullius Cicero4. He is most commonly known as simply Cicero, though for some obscure reason philosophers like to call him "Tully"―sort of a nickname, I guess. Cicero is, of course, a famous Roman orator, politician, and lawyer of the first century B.C.E. He also has a bit part in Shakespeare's Julius Caesar, a play famous for the oratory of Brutus and Mark Antony's funeral oration, though Cicero himself only talks about the weather.
Cicero never actually wrote a book called How to Win an Argument, and not merely because he didn't write English; neither did he write a book whose Latin title might reasonably be translated as "How to Win an Argument". Instead, this new tome is a compilation of selections from Cicero's writings that have some bearing on the title topic, as selected, edited, and translated by James M. May, a rhetorician and classics professor. The book is thus subtitled: "An Ancient Guide to the Art of Persuasion".
Its main sources seem to be Cicero's De Inventione2, which means "On Invention"―in rhetoric, "invention" refers to the process of inventing arguments―and De Oratore3, "On the Orator". I've never read either book, so I've no idea how much light they cast on the subject of winning arguments, but I look forward to reading the new one and finding out.
Sources & Resources:
- New Book: Winning Arguments, 12/22/2016
- Cicero, "De Inventione", Classic Persuasion
- Cicero, "De Oratore", Internet Archive
- John Ferguson & John P. V. Dacre Balsdon, "Marcus Tullius Cicero", Encyclopaedia Britannica, 5/12/2015
- William Shakespeare, Julius Caesar, I. ii.
January 8th, 2017 (Permalink)
Charts & Graphs
Longtime friend of The Fallacy Files Lawrence Mayes sends in the following unusual graph* that he found:
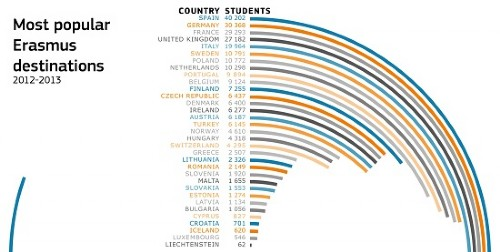
I've never seen anything like it before, which makes it difficult to interpret. However, this difficulty might be justified if it were a genuinely new way to present information in a graphical form, since any new type of chart will take some getting used to. But, it's not. Lawrence asks:
What parameter is used to illustrate the figures? Line length or angle? The answer is line length.
This is because this graph is actually our old familiar friend the bar chart, only it has been turned on its side―which is alright, or at least it's been done before. In a bar chart, it's the length of the bars―or narrow, line-like bars in this case―that convey data. In a pie chart, it's the angle of a slice of the pie that carries information, which is usually a fraction of a whole.
Here, the curving length of the thin bars represents the number of students who travelled to the countries listed down the middle. However, the bars are so long that they seem to have drooped down in a curve from their own weight. Either that, or this is a bar graph that really wants to be a pie chart. Lawrence explains why this is problematic:
The eye is likely to use the angle as the measure and this is where an error may arise. It's almost an optical illusion―the smaller number of students lie on the circumferences of smaller circles―and a smaller length goes further around the circle. Thus, for example, Turkey attracts about one fifth of those students attracted by Germany but it looks like it's nearer half (45 degrees vs 90 degrees).
Another instance of the same illusion is the five countries Czech Republic, Denmark, Ireland, Austria, and Turkey. The curving lines of these nations all appear to be the same length, yet the number of students visiting each ranges from a low of 6,145 for Turkey to 6,437 for the Czech Republic. The whole point of a bar chart is to make it possible to visually compare the sizes of different sets without having to look at the numbers, but curving the bars in this way defeats that purpose.
As if that weren't bad enough, Lawrence points out:
The case of Spain is really bizarre―it looks like it's gone round the circle by over 280 degrees but actually what they've done is to break off the line at 90 degrees and stick the bit they broke off back on the diagram at the left.
I doubt that the chartmaker intended that anyone think that Spain had over three times as many student visitors as Germany, though that would be a natural impression. Rather, I suspect that the maker was just trying to come up with a chart that was novel and visually-striking, and succeeded. It's a pretty picture, but as far as communicating data goes, you'd be better off ignoring the curvy colored lines and just read the numbers down the middle.
Source: "270 000 students benefitted from EU grants to study or train abroad", Ibercampus, 11/7/2014