Previous Month | RSS/XML | Current | Next Month
July 31st, 2016 (Permalink)
An Average Puzzle
Here's a puzzling pair of facts:
- The average annual salary for a mayor in the United States is $62,000.
- The average annual salary for a deputy mayor in the U. S. is $83,000.
So, suppose you have your choice between being mayor or deputy mayor of a city, which should you choose, assuming that your only concern is money?
July 16th, 2016 (Permalink)
Lesson in Logic 12: Two-Circle Venn Diagrams
The previous lesson explained how circles can be used to represent classes and how Venn diagrams show that a class is empty or non-empty. If you haven't learned that lesson or don't already understand how circles represent empty or non-empty classes, you should start with the previous lesson―see the link, below.

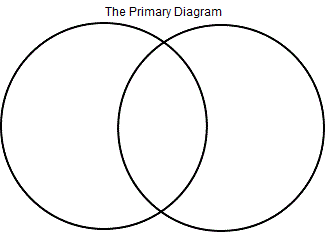
In this lesson, we will add an additional circle and see how logical relations between two classes are represented in Venn diagrams. Venn's innovation was to realize that two overlapping circles, which he called "the primary diagram", can be used to represent the basic logical relations between two classes―see the diagram to the right. All two-circle Venn diagrams start with the primary diagram.

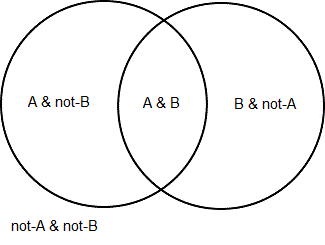
As you learned in the previous lesson, a single class circle divides the universe of things into two subclasses: those things that belong to the class and those things that do not belong to the class; the former occupy the interior of the circle and the latter lie outside it. In the primary diagram there are two circles representing two distinct classes―let's call them "A" and "B". The primary diagram divides the entire universe into four subclasses: things that are A but not B, things that are B but not A, things that are both A and B, and things that are neither A nor B. Letting the left circle represent A and the right B, the diagram to the right shows which sections of the circles represent each of the four subclasses.
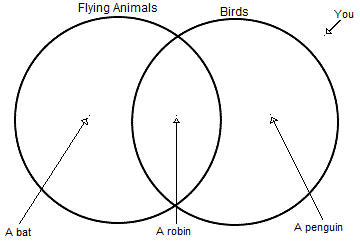
Exercise 1: Draw a primary diagram and label one of the circles "Birds" and the other "Flying Animals". Now, indicate on the diagram where you would find a robin, a penguin, a bat, and yourself.
So far, the two-circle diagrams that you have seen don't say anything about the relations between the two classes. However, to say something about the logical relations between classes, you will use the same system of shading a subclass to indicate that it is empty and marking one with an "X" to show that it's not empty. If you understand the class regions of the two-circle diagram as tested in the above exercise, and if you know how to use shading and Xs to represent empty or non-empty regions, then you should be able to do the following exercise.
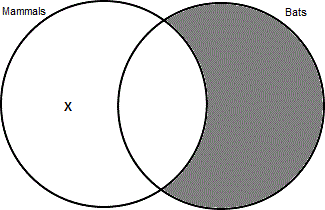
Exercise 2: Start by drawing the primary diagram, then label one circle "Mammals" and the other "Bats". Now, represent that the class of bats that are not mammals is empty. Also, represent that the class of mammals that are not bats is non-empty.
In the next lesson, you will learn how to use the two-circle diagram to represent statements about the logical relationships between two classes.
Source: Sun-Joo Shin, Oliver Lemon & John Mumma, "Venn Diagrams", Stanford Encyclopedia of Philosophy, 2013
Previous Lesson: Lesson in Logic 11: Class Diagrams, 6/22/2016
July 2nd, 2016 (Permalink)
New Book: Everydata
A new book by John H. Johnson and Mike Gluck is called Everydata: The Misinformation Hidden in the Little Data You Consume Every Day.
What's up with that title? Here's what they say about it:
Everydata isn't a real word. Not yet, anyway. We made it up to describe the tons of data that you encounter every day. (Preface)
So, "everydata" appears to be a portmanteau word combining "everyday" with "data", and thus short for "everyday data". I don't much care for the word―so I hope it never actually becomes a "real word"―but the topic, which the Preface describes as follows, sounds intriguing:
Every day, you're surrounded by media reports and other sources that are often filled with hidden information―and misinformation. This book will help you to identify it, interpret it, and become an educated consumer of data…. (Preface)
Using Amazon's "Look inside!" feature to glance through it, the book appears to cover such topics as sampling, averages, correlation and causation, polling, and cherry-picking. These should be familiar topics to regular readers of this site, but it's good to see them reaching a wider audience. Also, it sounds rather like last month's new book (see the Resource, below), but there's certainly enough grist for two mills.
Johnson is an economist and statistician, so he should know how to interpret everyday data; and Gluck is a writer, so he should know how to, well, write. I'm going to aim for reviewing it here next month.
Resource: New Book: Truth or Truthiness, 6/18/2016
Answer to an Average Puzzle: You should choose to be mayor. The fact that on average deputy mayors make more than mayors does not mean that there are any cities that pay their deputy mayors more than their mayors. The reason that deputy mayors make more on average than mayors is that most small to medium-sized towns and cities have mayors, but no deputies, and such cities usually pay their mayors small salaries. Only larger cities have deputy mayors, and they tend to pay mayors more than small towns do. However, as you probably suspected, it would be highly unusual for a city to pay its mayor less than its deputy mayor. So, if you have a chance to become mayor of a city large enough to have a deputy, you will receive a higher salary as mayor than your deputy.
Source: John H. Johnson & Mike Gluck, Everydata: The Misinformation Hidden in the Little Data You Consume Everyday (2016), p. 35

