Over-Extrapolation
Alias: Uncritical Extrapolation1
Taxonomy: Logical Fallacy > Formal Fallacy > Probabilistic Fallacy > Over-Extrapolation
Quote…
…[T]he Mississippi between Cairo and New Orleans was twelve hundred and fifteen miles long one hundred and seventy-six years ago. It was eleven hundred and eighty after the cut-off of 1722. It was one thousand and forty after the American Bend cut-off. It has lost sixty-seven miles since. Consequently, its length is only nine hundred and seventy-three miles at present. Now, if I wanted to be one of those ponderous scientific people, and "let on" to prove what had occurred in the remote past by what had occurred in a given time in the recent past, or what will occur in the far future by what has occurred in late years, what an opportunity is here! … Please observe: In the space of one hundred and seventy-six years the Lower Mississippi has shortened itself two hundred and forty-two miles. That is an average of a trifle over one mile and a third per year. Therefore, any calm person, who is not blind or idiotic, can see that in the Old Oolitic Silurian Period, just a million years ago next November, the Lower Mississippi River was upward of one million three hundred thousand miles long, and stuck out over the Gulf of Mexico like a fishing-rod. And by the same token any person can see that seven hundred and forty-two years from now the Lower Mississippi will be only a mile and three-quarters long, and Cairo and New Orleans will have joined their streets together, and be plodding comfortably along under a single mayor and a mutual board of aldermen. There is something fascinating about science. One gets such wholesale returns of conjecture out of such a trifling investment of fact.2
…Unquote
Form:
Values of a variable are estimated beyond observed data, usually in a straight line, extending so far past the known values that the results are unreliable.

|
Exposition:
Extrapolation is the process of estimating values of a variable outside the range of known values, where the estimated values are either less than or greater than the known data3. Extrapolation extends an observed trend of the data and, because straight lines are simple, it usually extends it in a straight line. For instance, suppose we weigh a ten-year old boy and record his weight over the course of three years. In 2018, he weighs 70 pounds, 80 pounds in 2019, and 90 pounds in 2020. We might then extrapolate and conclude that he will weigh 100 pounds in 2021. This is an example of linear extrapolation since it assumes that his weight will continue to increase in a straight line as he grows4.
"Over-extrapolation" refers to extrapolating in a reckless, excessive manner, usually by carrying the extrapolation far beyond the known values. For instance, it's probably fairly safe to conclude that the boy in the previous paragraph will weigh approximately 110 pounds in 2022. However, it would probably be over-extrapolating to claim that he will weigh 200 pounds in 2031 when he is 23 years old, and it would certainly be taking the extrapolation too far to conclude that he will weigh 300 pounds in 2041 at the age of 33.
This example shows one common way that extrapolation goes wrong: we know that people do not gain weight linearly. As children grow, their weight may increase in approximately a straight line, but as they come to adulthood, the line will start to bend and probably flatten. Many processes in nature, such as growth, are not linear. Growth may appear to be linear for a time, which can tempt people to extrapolate it as a straight line, but we know that it cannot continue that way far into the future.
Exposure:
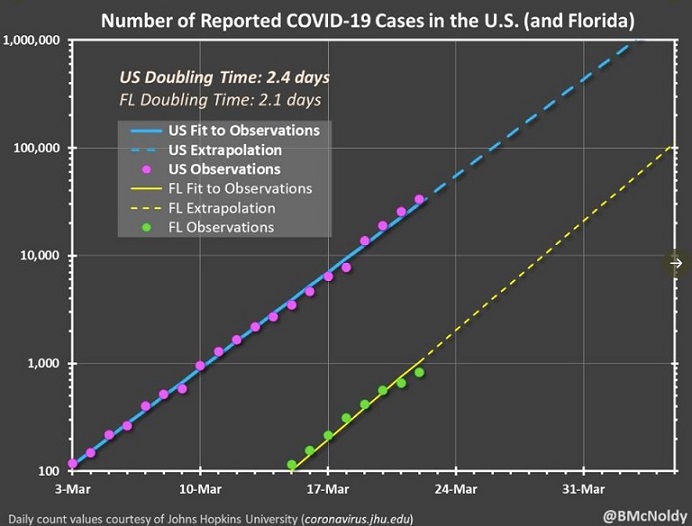
Extrapolation is a useful statistical tool, but all extrapolated values are at best hypotheses. How do we know when extrapolation goes too far and becomes over-extrapolation? The distinction between reasonable and unreasonable extrapolation is a fuzzy one, which means there is no precise point at which it crosses over from the one to the other. Generally, the farther an extrapolation gets from the known data, the less trustworthy it becomes. Eventually, an extrapolation may get so far away from reality that it becomes obviously excessive. This is the source of humor in examples such as the Mark Twain quote, above, which is taken to the point of absurdity. Less absurd, and definitely less funny, is the over-extrapolation in the Example chart, above.
Analysis of the Example:
If you examine the graph you'll notice that both lines, the blue one for the United States as a whole and the yellow one for Florida, are extrapolated―represented by broken lines―beyond the date of the graph, which was March 23rd, 2020. The blue broken line disappears off the top of the chart somewhere between April 2nd and 3rd, whereas the yellow broken line continues to the right side of the chart, which ends at April 5th.
Notice, also, that the scale on the y-axis is logarithmic, that is, it increases by factors of ten: 1,000; 10,000; 100,000, etc. So, even though both extrapolated trend lines are straight, this is actually exponential extrapolation rather than linear.
According to these extrapolations, the number of confirmed COVID-19 cases in the U.S. should have reached one million around April 2nd or 3rd. Instead, over two weeks later it still had not exceeded one million5. Similarly, the extrapolation for Florida shows almost exactly 100,000 cases on April 5th, whereas there were only about a quarter that many confirmed cases over two weeks later6. Clearly, these were over-extrapolations.
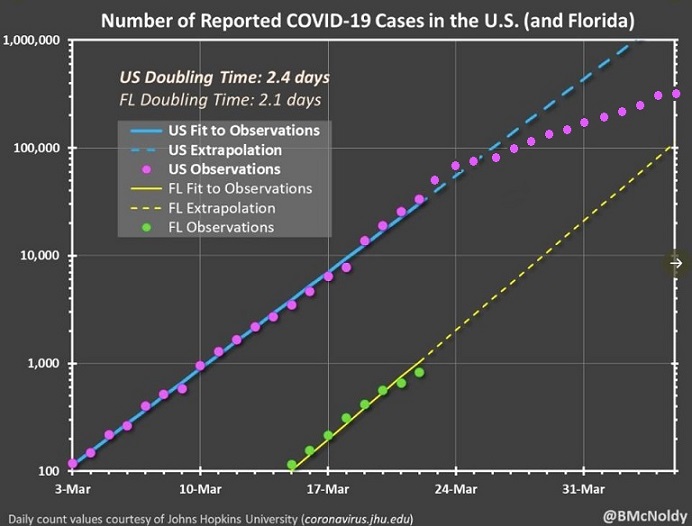
What went wrong with these extrapolations? Like many natural phenomena, epidemics tend to follow a bell curve: there is a rising number of cases of the disease, which can be an exponential rise, then the increase slows, plateaus, and then new cases decline. The chart was created during the early part of the epidemic when new cases were increasing exponentially, but by early April, when the chart ends, the rate of new cases was slowing. The epidemic peaked in mid-April, beyond where the chart ends, and the rate of new cases began to decline thereafter.
In order to show what happened when this extrapolation met up with reality, I've updated the original chart with additional data for the number of confirmed cases in the United States as a whole from March 23rd to April 5th; see below. I've not updated it for cases in Florida, but they would follow a similar pattern.

|
As you can see, the extrapolated values in the chart were approximately correct for the first several days after March 22nd, but the farther the line proceeds into the future, the farther the actual values get from the predicted values. If the chartmakers had been appropriately cautious, they would have cut off the right end of the chart around March 26th or 27th.
Notes:
- Stephen K. Campbell, Flaws and Fallacies in Statistical Thinking (1974), pp. 39-41, 174-175 & 198.
- Mark Twain, Life on the Mississippi, ch. 17.
- Roger Porkess, The Harper Collins Dictionary of Statistics (1996); Carol Gibson, editor, The Facts on File Dictionary of Mathematics (revised & expanded edition, 1988) & James & James, Mathematics Dictionary (multilingual edition, 1968).
- Derrick Niederman and David Boyum refer to this tendency as "the Linearity Trap", see: What the Numbers Say: A Field Guide to Mastering Our Numerical World (2003), pp. 81-84.
- To be exact: 746,625. "Cases of Coronavirus Disease (COVID-19) in the U.S.", Centers for Disease Control and Prevention, accessed: 4/21/2020.
- To be exact: 26,314. "Florida Department of Health Updates New COVID-19 Cases, Announces Eight Deaths Related to COVID-19, Evening Update", Florida Health, accessed: 4/21/2020.
Created: 4/21/2020, revised: 9/17/2021