Previous Month | RSS/XML | Current | Next Month
WEBLOG
August 26th, 2025 (Permalink)
The Jacksonville Fallacy?
A couple of years ago, Governor Ron DeSantis claimed that crime in his state of Florida was at a fifty-year low while "major" crime in New York City had increased by 23% the previous year1. Now, this is not a fact check but a logic check, so I'm just going to assume that the statistics given by DeSantis and others quoted in this entry are factually correct. Instead of fact-checking these statistics, the question I'm addressing is: What if anything do they prove?
Some critics of DeSantis replied that the homicide rate in Jacksonville, Florida was actually three times greater than that in the Big Apple2: specifically, that the homicide rate per 100K in 2022 was 16.7 in Jacksonville but only 4.8 in New York City. Of course, both of these sets of statistics can be correct: it's quite possible that crime was decreasing in Florida and increasing in New York as DeSantis claimed, but was worse in Florida than in New York as his critics claimed. But even if the statistics are correct, the governor could rightfully be criticized for cherry-picking the ones that made his state look good.
A defender of DeSantis rebutted the critics by citing the number of murders per square mile in 2022 in Jacksonville: 0.19, and New York City: 1.383. This is a statistic of dubious value in comparing the amount of murder in two places since it's affected by population density: the higher the density, the more murders per square mile. New York no doubt has much greater population density than Jacksonville. Moreover, this particular comparison is affected by a piece of trivia appropriate for a Ripley's cartoon4 or the Guinness book of world records.
What is the largest city in area in the contiguous United States, that is, the "lower 48"? This is a trivia question rather than a logic puzzle, so you either know the answer or you can look it up, but you can't figure it out. You might guess that it's Los Angeles, a notoriously spread-out city, but that's wrong. Do you give up? The answer is Jacksonville, Florida5.
So, even if it made sense to compare cities on the basis of murders per mile², it wouldn't be fair to compare New York City to Jacksonville, given that the latter is the largest city in area in the lower forty-eight, but only the eleventh in population size6.
Despite the title, I'm not ready to add an entry to the files for statistical fallacies that take advantage of Jacksonville's trivial status as the lower 48's biggest city in area. However, I've now come across two examples and if I find one more, I may just do so.
Notes:
- ↑ Ron DeSantis, "I visited Staten Island to talk about how law & order has been central to FL's success.", X, 2/20/2023.
- ↑ Mark D. Levine, "Homicides per 100k residents in 2022…", X, 2/20/2023.
- ↑ See: Heather Kofke-Egger, "Murders Per Square Mile", Data Behind the Data, 2/22/2023.
- ↑ See: The Talented Mr. Ripley, 5/19/2025.
- ↑ See: May I Puzzle You?, 5/20/2005.
- ↑ "Largest US Cities by Population 2025", World Population Review, accessed: 8/25/2025.
August 20th, 2025 (Permalink)
Lesson on Logic 21: Euler Diagrams
In previous lessons1, we saw how Venn diagrams are used to represent logical relations between classes. However, as pointed out previously, Venn's diagrams are limited to representing the relations between three classes. There are extensions of Venn's diagrams but they become increasingly awkward with increasing numbers of class terms. When faced with polysyllogisms―that is, categorical arguments involving four or more class terms―one way to work around this problem was explained in Lesson 19, namely, breaking such arguments down into a chain of categorical syllogisms.
As I mentioned in the previous lesson, the technique of turning a complex argument into a chain of simpler ones can show that the argument is valid but not that it's invalid. This is because that technique is a method of proof, and it's a general fact that a given argument's failure to prove its conclusion doesn't mean that no other would do so. In contrast, a Venn diagram either shows an argument valid or invalid. For this reason, it would be nice to have such a diagrammatic technique for polysyllogisms.
Prior to John Venn, Leonhard Euler used circles to represent the logical relationships between classes2. In my opinion, Euler's diagrams for the universal statements of categorical logic are more intuitive than those of Venn, but unfortunately those for the particular statements were neither intuitive nor useful. This problem led Venn to keep the circles but take a different approach to representing all types of categorical statement, which is a shame given the limitations of his approach both in intuitiveness and in number of terms diagrammable.
In this lesson, I will simply introduce Euler's diagrams and show how they are used to represent the logical content of universal statements but, in a future lesson, we'll see how to evaluate categorical arguments.
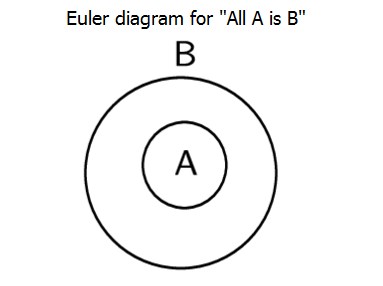
Euler did not have anything corresponding to Venn's primary diagrams3, which divide up all of the logical space of the diagram into every possible subclass of two or three classes. Instead, of using shading to show that certain classes were empty, Euler used the spatial relationship between the circles themselves to indicate such relationships. So, here's how Euler represented universal affirmative statements―that is, A statements:
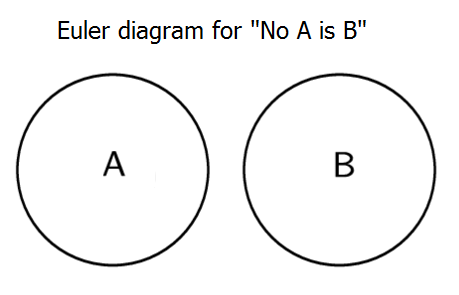
Similarly, to represent universal negative statements―that is, E statements―Euler drew the circles so that they did not overlap. In my view, these diagrams are more intuitive representations of these categorical relationships than the corresponding Venn diagrams, since you can see that one class is contained within another or that the two classes are disjoint.
Since Euler's methods of representing particular statements were inadequate and not as intuitive as those for universal ones, we can adopt the convention of placing a mark inside a class or subclass to indicate that it is non-empty.
In the next lesson, we'll start looking at how to use this combination of Euler and Venn diagrams to evaluate categorical arguments.
Notes:
- ↑ See:
- Class Diagrams, 6/22/2016
- Two-Circle Venn Diagrams, 7/16/2016
- Categorical Statements, 8/17/2016
- Equivalence, 11/15/2016
- Contradiction, 12/13/2016
- The Third Circle, 2/16/2017
- Pretzel Logic, 4/28/2017
- Categorical Syllogisms, 5/22/2017
- Polysyllogisms, 6/19/2025
- Venn Diagrams, Invalidity and Counter-Examples, 7/29/2025
- ↑ Leonhard Euler, Lettres à une Princesse D'Allemagne (1843), Lettre xxxiv.
- ↑ See lessons 12 & 16.
August 11th, 2025 (Permalink)
A Rising Tide
It's time once again to play America's favorite game: Name that fallacy! Here's how it's played, in case you haven't played before: I will show you a passage from a written work and your task is to identify the logical fallacy committed. It's not so important whether you can actually put a name to it if you recognize the nature of the mistake. So, let's get started.
What logical fallacy is committed by the following passage?
Should it surprise anyone that alcohol abuse in America has been rising, not falling? The number of adults who either consume too much alcohol or have an outright dependency on it rose from 13.8 million in 1992 to 17.6 million in 2002, according to the National Epidemiologic Survey on Alcohol and Related Conditions (NESARC).1
Explanation: The quoted passage occurs in a book criticizing the "self-help movement" as a failure or even counter-productive. So, its point seems to be that, despite the efforts of Alcoholics Anonymous and other self-help organizations, alcohol abuse had actually increased in the period of time prior to the book's publication.
The two statistics cited, taken from the NESARC survey, indicate that the number of Americans who drink too much alcohol increased by 3.8 million from 1992 to 20022. This would be a whopping 27.5% increase in only slightly more than a decade. However, this increase is based on comparing the absolute numbers of those who drank too much in the two years a decade apart, while the population increased in the intervening years. As a result, the rise in population would be expected to increase the number of over-drinkers: a rising tide raises all boats. So, one could answer the author's question: "No, it should surprise no one that alcohol abuse in America rose in that decade since the population increased during it."
One way to take the increase in population into account is to calculate the fraction of the population estimated to have a drinking problem for each of the two years so that the population is accounted for in the denominator. Then these fractions can be turned into percentages by multiplying them by 100.
How much did the population increase? In 1992, the population was 260 million3 but it had increased to 287 million by 20024. This is slightly more than a ten percent increase, so that population increase alone would account for the number of problem drinkers increasing by 1.38 million to a little more than 15 million in 2002, which leaves an increase of about 2.5 million unaccounted for.
Doing the math, 5.3% of the population drank too much in 1992, whereas in 2002 it had increased to 6.1%5, or an increase of .8 of a percentage point. So, it appears that the number of Americans who abuse alcohol may have increased in the decade in question, but citing the absolute numbers while ignoring the increase in population exaggerates that increase. The author could have made his case without exaggeration, at least in the case of alcohol abuse, by pointing to the fact that the two statistics showed no decline, and perhaps even an increase in such behavior.
Notes:
- ↑ Steve Salerno, SHAM: How the Self-Help Movement Made America Helpless (2005), pp. 227-228.
- ↑ "Alcohol Abuse Increases, Dependence Declines Across Decade: Young Adult Minorities Emerge As High-Risk Subgroups", National Institute on Alcohol Abuse and Alcoholism, 6/10/2004.
- ↑ "What was the population of the United States in 1992?", Wolfram Alpha, accessed: 8/9/2025.
- ↑ "What was the population of the United States in 2002?", Wolfram Alpha, accessed: 8/9/2025.
- ↑ The news release cited in note 2, above, gives these percentages as 7.4% for 1992 and 8.5% for 2002, for a slightly larger increase of 1.1 percentage points. The release does not give the population data on which these percentages were figured, so I used the data cited in the previous two notes.
August 3rd, 2025 (Permalink)
Crack the Combination X*
The combination of a lock is four digits long and each digit is unique, that is, each occurs only once in the combination. The following are some incorrect combinations.
- 3 5 6 0: Two digits are correct but only one is in the right position.
- 2 6 7 0: Two digits are correct but neither is in the right position.
- 7 2 8 6: Three digits are correct but none is in the right position.
- 4 0 2 5: One digit is correct and in the right position.
Can you determine the correct combination from the above clues?
It might help to start with the third clue.
8 7 6 5
* ↑ Previous "Crack the Combination" puzzles: I, II, III, IV, V, VI, VII, VIII, IX.

August 1st, 2025 (Permalink)
Photos Don't Lie, but Photographers Do
- Hany Farid, "How to Spot Fake AI Photos", TED, 7/18/2025
Though fake photography and videography are becoming increasingly sophisticated, there are still many photos and videos in the media that use techniques that have been around since the beginnings of photography, such as selective editing2, false captioning3, or cropping4. The following article describes a couple of recent cases. Warning: the photos are unpleasant to look at, which is part of their effectiveness as propaganda.
- Miriam Metzinger, "When Images Mislead: The Facts Behind 2 Viral Gaza Cases", The Media Line, 7/30/2025
The following short video won't teach you much about how to spot fake photographs generated by so-called artificial intelligence, so it's misleadingly named. However, you might be able to use the geometric techniques briefly demonstrated. Instead, it shows why spotting phony photos and videos is becoming a task for professionals. The presenter is the author of a book―not for amateurs―on analyzing and exposing faked photography1, which contains more detail on the techniques for analyzing perspective and lighting. By the way, I quite agree with the presenter's comments on anti-social media near the end of the video.
Notes:
- ↑ Hany Farid, Fake Photos (2019). Highly technical book with a lot of mathematics, so appropriate for professionals or those with the mathematical background looking to become professionals.
- ↑ See: How to Lie with Photographs, Part 1, 12/9/2023.
- ↑ See: How to Lie with Photographs, Part 2, 5/11/2024.
- ↑ See: How to Tell Half-Truths with Photographs, 2/12/2025.
Disclaimer: I don't necessarily agree with everything in the video and article, but I think they are worth watching or reading in their entirety.