Previous Month | RSS/XML | Current | Next Month
WEBLOG
January 31, 2015 (Permalink)
The Puzzle of the Four Stooges
It was a daring daylight robbery gone wrong. Three men in Hallowe'en masks planned to rob a diamond courier carrying a fortune in uncut diamonds in a briefcase. An innocent businessman carrying an identical briefcase happened to be crossing the street on his way back from work at the same time the courier was supposed to arrive. While one of the gang waited in a car with a running motor, another kept a lookout for the police. The third masked man confronted the businessman, brandished a gun, and demanded the briefcase. The businessman handed over the briefcase immediately, which made the crook suspicious. Then and there, the crook opened the briefcase and only papers fell out, scattering across the sidewalk. Without warning, the criminal shot the man and fled.
The three crooks were quickly apprehended, and the three masks were found in the trunk of their getaway car along with a revolver containing one spent cartridge. The masks were a set representing the Three Stooges comedy team. Each "Stooge" told a different story as to who had done what in the robbery, and even who had worn what mask. They did agree that one of them had driven the getaway car, another had stood lookout, and the third was the gunman. The few eyewitnesses to the shooting agreed that a masked man had pulled the trigger, but couldn't identify which Stooge the mask was supposed to represent.
Thankfully, the businessman will live, but the District Attorney wants to charge the criminal who pulled the trigger with attempted murder. For the sake of convenience, we'll refer to the criminals under their noms-de-stooge. This is their testimony:
Curly: I was the driver and Larry was the lookout.
Larry: Don't listen to what Curly says! He was the lookout and I was drivin'.
Moe: Pay no attention to those two. I drove and Curly was the triggerman.
It turned out that there was a fourth "Stooge"―let's call him "Shemp"―a criminal who knew the three crooks involved in the robbery and participated in their crimes when a fourth was needed. Here's what he reluctantly told the police:
Shemp: I wasn't there so I don't know who did what, but I can tell you that nobody was supposed to get hurt. There wasn't supposed to be no shootin'. I don't know why he shot that guy; that was just plain stupid! I guess he got mad when he saw there was no diamonds. Anyway, the only reason I'll tell you anything is 'cause of that. They hadn't oughten to be shootin' people. Anyway, one of those three stooges lies all the time and everything he says is a lie. Another one of 'em is too dumb to lie. The other is a regular guy: sometimes he lies and sometimes he don't, and I happen to know 'cause he told me that this time he told one lie and one truth. But I won't tell you which of them stooges is which; that you'll just have to figure out yourself.
Assuming that Shemp is telling the truth, can you figure out yourself which "Stooge" shot the victim?
January 25, 2015 (Permalink)
A Mutant Statistic
…[W]hen statistics seem incredible, when we find ourselves wondering whether things can possibly be that bad, it can be worth trying to figure out how a number was brought into being. Sometimes we can discover that the numbers just don't add up….―Joel Best
An article about some states requiring that high school students pass a test for United States citizenship in order to graduate―see Source 2, below―makes the following claim about the amount of time spent in public schools on civics:
The Center for Education Policy conducted surveys of school districts across the nation that showed the time spent on [civics and social studies] subjects in elementary schools was reduced from an average of 2,239 minutes per week in 2000 to 164 minutes per week in 2008, a 93 percent decrease.
Horrors! I didn't realize that things were so bad. But wait a minute: are they really that bad? Is it plausible that the amount of time devoted by elementary schools decreased so precipitately in eight years? Don't just assume that because you see it in black on white on your computer screen that it must be true. How would you go about testing these numbers for plausibility using what you already know? When you think you know the answer, click on "Sanity Check", below, to see one such test.
Sources:
- Joel Best, Stat-Spotting: A Field Guide to Identifying Dubious Data (2008), pp. 24-25
- Rod Kackley, "Is Making High School Students Pass Citizenship Test the Right Move?", PJ Media, 1/22/2015
January 23, 2015 (Permalink)
Blurb Watch: Selma
If you wondered whether blurbs for the movie Selma would take the kind of liberties with the reviews they quote that the movie itself does with history, here's one answer. A newspaper ad for the movie included the following quote:
"In impact and import, 'SELMA' IS THE FILM OF THE YEAR."
RICHARD CORLISS, TIME
Here's the context of the quote from Corliss' review:
If not quite in quality then certainly in import and impact, this is the film of the year―of 1965 and perhaps of 2014.
I understand why "perhaps" was left out of the blurb, together with the part about how it's "not quite" the movie of the year "in quality", but why were the words "impact" and "import" switched? The ways of the blurber―blurbist?―are strange.
Sources:
- Ad for Selma, The New York Times, 1/23/2015, p. C15
- "Movie Blurbs, The Inside Story", Inside Edition, 11/25/2013. From a little over a year ago, a general article on how good blurbs happen to bad movies.
- Richard Corliss, "Review: Selma Is the Film of the Year―But 1965 or 2014?", Time, 1/1/2015.
- Ron Radosh, "The Truth, History, and the Movie Selma", PJ Media, 1/12/2015.
- Mark K. Updegrove, "What 'Selma' Gets Wrong: LBJ and MLK were close partners in reform", Politico Magazine, 12/22/2014.
January 17, 2015 (Permalink)
A Not So Crystal-Clear Graph
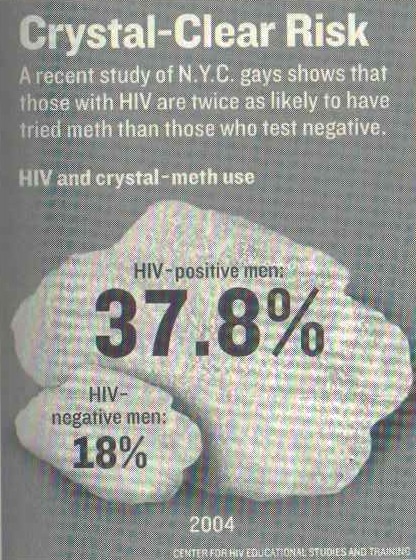
Can you see anything wrong with the chart shown? If you compare the two rocks of crystal meth pictured, the bigger one appears to be several times the size of the smaller. However, if you pay attention to the numbers superimposed on the rocks, the larger percentage is only a little more than twice the size of the smaller. What's going on here?
Though it might not look like it, this appears to be a "one-dimensional pictograph", to use Darrell Huff's phrase―see the Resource, below―which is a bar chart that substitutes pictures for bars. The rocks of meth spread out so much that they might not appear to be standing in for the bars of a bar graph, but if you measure each rock from its bottom to its top you'll see that the larger rock is slightly more than twice as tall as the smaller one. Thus, it's my guess that the graph-maker started out with a bar chart, but wanted to make it more visually striking by replacing the bars with the rocks.
A further problem comes from the use of tenths of a percent on the larger rock. Was the study in question really that precise about what percentage of HIV-positive men had tried crystal meth? Such precision is unheard of in what must be a survey of homosexual men in New York City.
In this case, a picture is not really necessary, since it's easy enough to compare two percentages, but the picture is actually misleading in a way that the numbers alone could not be. So, using a graph such as this is worse than having no graph at all.
Source: Joel Best, Stat-Spotting: A Field Guide to Identifying Dubious Data (2008), pp. 22-24. The example graph is on page 23, and originally accompanied an article from Newsweek magazine.
Resource: The One-Dimensional Pictograph, 8/1/2013
Fallacy: Overprecision
January 16, 2015 (Permalink)
A Major Fallacy
It's time once again to play "Name That Fallacy!". This is the game where you read a passage and name the fallacy committed in it. So, let's get started:
"…I thought you'd been in the cavalry," Fen said to the Major as they walked on. "Before it was mechanised, I mean.""Quite right, my dear fellow. Twenty years of it, I had, in India."
"But didn't that get you used to horses?"
"No, the reverse," said the Major. "The more I saw of horses, the more unused to them I got. I was drunk for a week," he confided, "celebrating the day they took them all away. Because after they'd gone, don't you know, I couldn't have a fall."
"You mean you'd had a lot of falls."
"No, none. I never had a fall, not even when I was learning to ride, as a child. Well, you can see what that implied. Theory of Probability and so forth," said the Major…. "The longer I went on without having a fall, the more likely it became that I would have one. In the end it got a bit unnerving, because every time I got on a horse, the chances were about a billion to one against my not having a fall. I won through, though," he said proudly. "I survived. No fall. I'm here to tell the tale. …"
When you think that you can put a name to the fallacy committed by the Major, click the link below:
Source: Edmund Crispin, The Glimpses of the Moon (Avon, 1979), p. 21
January 13, 2015 (Permalink)
"I was told there would be no math."
Perhaps it would be too much to expect that business and economics writers for Slate could do simple math. But it shouldn't be too much to expect that they know how to use a calculator. Check out the following correction appended to an article from Slate's "Moneybox", "a blog about business and economics"―see the Source, below:
Correction, Jan. 12, 2015: This post originally misstated that Burger King�s 10-piece chicken nuggets were selling for $1.49, or 10 cents per nugget. $1.49 for 10 nuggets is about 15 cents per nugget.
I suppose that it's also too much to expect that Slate might have fact checkers. "Who do you think we are," I imagine the magazine's writers replying, "the bleeping New Yorker?" But does "Moneybox" at least have an editor? Since it's called a "blog", perhaps that means that it's unedited.
I point this out not just to make fun of Slate―that's a bonus!―but because there's a serious issue here: It's a mistake to assume that reporters are able or willing to do even the simplest math. Apparently, we can't even expect journalists who specialize in economics and business to be able to move a decimal point one place to the left.
Source: Alison Griswold, "Burger King Hopes You�re Lovin� Its 15-Cent Chicken Nuggets Promotion", Slate, 1/12/2015
Resource: Innumeracy at Slate, 11/6/2011
January 8, 2015 (Permalink)
The Fine-Tuning Argument Strikes Again!
On Christmas day last year, The Wall Street Journal published an article with the following headline―see Source 1, below:
Science Increasingly Makes the Case for God
In the article beneath, Eric Metaxas made a scientific case for the existence of a god. What I don't understand is why he didn't make the scientific case for Santa Claus. Metaxas' argument is the familiar one based on "fine-tuning", which I've already had my say about―see the Resource, below. Even if all of Metaxas' scientific claims are correct―which I doubt―that doesn't affect the fundamental problem with the fine-tuning argument.
Metaxas writes:
…[T]he odds against the universe existing are so heart-stoppingly astronomical that the notion that it all �just happened� defies common sense. It would be like tossing a coin and having it come up heads 10 quintillion times in a row. Really?
No, not really. This is a bad analogy. It's more like being dealt a hand in bridge: the odds against being dealt any particular bridge hand are also astronomical―specifically, 1 in 635,013,559,600―but nobody concludes that the deck must have been stacked by the dealer to produce that particular hand.
Moreover, Metaxas seems to think that if the odds are a billion to one "against the universe existing" instead of a million to one, then the argument is stronger. Would odds of a trillion to one instead of a billion to one make the argument a thousand times stronger? If the argument was any good then odds of a million to one would be plenty, but odds of a gazillion to one won't turn a bad argument into a good one.
Also, with "odds against the universe existing" of ten quintillion to one, why doesn't Metaxas conclude that it doesn't really exist, despite appearances? If you really must draw a religious conclusion from this claim, why not conclude that the physical universe is an illusion? While I'm pretty convinced that the physical universe does indeed exist, I'm not sure that the evidence of its existence is strong enough to overcome a prior probability against it of 10 quintillion to one.
By the way, I'm not completely joking about Santa Claus. Metaxas published a book last year titled Miracles, which I see from the miracle of Amazon's "Look Inside!" feature has a chapter on "The Miracle of the Universe". Is this article drawn from that chapter of the book? Unfortunately, "Look Inside!" doesn't let me look inside that chapter, and I don't currently have access to a copy of the book, so I don't know. However, the usual argument against Santa is that it would take a miracle for him to do what he's supposed to do on Christmas eve. Thankfully, Metaxas seems to have overcome that objection.
Source: Eric Metaxas, "Science Increasingly Makes the Case for God", The Wall Street Journal, 12/25/2014.
Resource: The Lottery Fallacy, 7/3/2014.
Via: Steven Novella, "The Science of God", Neurologica Blog, 1/8/2014. Novella has a go at debunking the questionable science in Metaxas' article.
January 6, 2015 (Permalink)
Check it out…or don't!
Philosopher and critical thinker Tim van Gelder had an opinion piece published in the Australian newspaper The Age last month on the perils of all-or-nothing thinking, though he doesn't call it that―see the Source, below. Instead, he calls it "Booleanism" after the logician and mathematician George Boole.
I would point out, in defense of Boole, that he was probably not a "Boolean" in van Gelder's sense of the term, and Thomas Bayes was almost certainly not a "Bayesian" as that term is currently used. Bayes was merely the first to prove the theorem that goes under his name―or, at least, the first to get credit for it. However, "Bayesianism" has come to refer to a whole philosophical view about probability developed by subsequent philosophers. In fact, van Gelder's description of Bayes' theorem as "a basic law of probability governing how to modify one's beliefs when new evidence arrives" is a reflection of that later theory, and not the way that Bayes himself would have described it. I mention this not to criticize the theory, since I'm as Bayesian as the next Bayesian―probably more so!
Of course, the proper Bayesian response to the Booleanism versus Bayesianism debate is not to reject Booleanism wholesale―that's the Boolean response to Bayesianism. Rather, the Bayesian should realize that Booleanism is often a useful approximation: not every issue is black or white, but some are. Furthermore, many issues are dark grey and off-white. In other words, the world may be painted in shades of grey, but some of those shades are so close to black or white as to make no practical difference. For example, you really are either going to read the whole thing or you won't―I suggest the former! So, all joking aside, check it out.
Source: Tim van Gelder, "Do you hold a Bayesian or Boolean worldview?", The Age, 12/3/2014
Via: Tim van Gelder, "From Booleanism to Bayesianism", 1/6/2015
Fallacy: The Black-or-White Fallacy
Sanity Check: (A Note of Clarification, 4/29/2015: The following sanity check involves testing the plausibility of the first number given in the comparison, that is, the supposed average of 2,239 minutes per week spent on social studies in 2000. As you will see below, it is this number which was incorrect. As far as I know, the second number given is correct, namely, 164 minutes spent on social studies per week in 2008. Thus, a sanity check of the second number should not show it as implausible.)
One way to test this claim is to compare it to the total amount of time spent by elementary students in school during a week. If you're like me, you have no idea how many minutes there are in a school week. Moreover, unless you're currently an elementary school student yourself―which seems unlikely―or you have children who are or recently were students, you may not know the answer precisely. However, for sanity checking we don't require a precise answer; all that we need is a ballpark figure. If you think about it, you probably have some idea of how many hours students spend in school each week, and you know how many minutes there are in an hour.
As far as I can remember, when I was in school it was for five hours a day, not counting an hour for lunch. However, this was a long time ago and things may have changed; moreover, my memory is only clear for high school, and it's possible that elementary school may have run an hour longer. Five hours a day five days a week is a total of 25 hours spent in class each week. Since there are 60 minutes in an hour, this means a total of 1,500 minutes per week. This is less than the supposed amount of time spent studying civics!
Clearly, something is wrong here, but let's not jump to the conclusion that it's the claim in the article. Perhaps my memory is wrong, or students spend more time in school today than they did when I was young. If we assume an additional hour of school per day, that would mean a total of 30 hours per week or 1,800 minutes. That's still less than the total number of minutes supposedly spent on social studies!
Let's reverse our procedure and start with the number of minutes given in the article: 2,239. If we divide by 60 we get the number of hours allegedly spent per week on social studies, which is approximately 37. So, even if we assume that elementary school students spend a 40 hour week in school, that would leave only three hours a week for English, mathematics, science, and all other subjects. We can now safely conclude that this number is insane.
How did such a ludicrous claim get into the article? Where did the number come from? According to the article, it comes from surveys done by the Center on Education Policy which cover the time period 2000-2008. I was able to find the study which was the source of this mutant statistic―see the Source, below―from which I quote: "…[T]he average total instructional time for social studies before NCLB [No Child Left Behind] was 239 minutes per week, compared with 164 minutes per week after NCLB."
Somehow, between the study and the article, the number mutated to include an extra "2" at the beginning, thus increasing it by an order of magnitude. This may have started out as an innocent typographical error, but the article went on to use the mutant number in claiming that the reduction in time spent on social studies from 2000 to 2008 is 93%, which is the percentage difference between 2,239 and 164. The actual percentage decline reported in the same table in the study that reports the numbers is only 32%, a far less alarming number. Like some mutants in evolution, the number possessed a trait useful for survival: it supported the article's argument. If the number had mutated in the opposite direction, it probably would have never made it into print.
Here are a couple of takeaway points:
- Don't assume that the numbers you see in the media are accurate. Sometimes they are wildly wrong, even in responsible sources.
- You don't need to be a statistician to spot erroneous statistics. Usually you will only need basic math, which is all we needed for this example. You will also need the healthy skepticism that comes from understanding the first point above, together with the willingness to think critically about the numerical claims you encounter.
Source: Jennifer McMurrer, "NCLB Year 5: Instructional Time in Elementary Schools: A Closer Look at Changes for Specific Subjects", Center on Education Policy, 2/20/2008, p. 4, Table 3 (PDF)
Via: "This seems…", Neo-Neocon, 1/24/2015. I first noticed the above claim from this article, and a similar sanity check was performed by a commenter. Good work!
Solution to the Puzzle of the Four Stooges: Curly shot the businessman.
Each of the three "Stooges" involved in the attempted robbery made two statements to the police for a total of six. Since, according to Shemp, one of them always lied, the liar's two statements will both be false. A second always told the truth, so his two claims will be true. Finally, the third said one true thing and one false. There are a total of six possible distributions of these truth-telling characteristics to the three crooks. However, for the criminal who made one true and one false statement, it might be the first that's true and the second false, or vice versa. This doubles the possible distributions of truth-values to a total of twelve.
So, one way to solve the puzzle is to go through all twelve distributions of truth-values, eliminating those that are impossible, which will leave only the one in which Curly is the shooter. However, if you look at their statements, you'll notice that each claims to have been the getaway driver, so at most one of those three statements can be true. This means that the driver is also the truth-teller, so that his other statement will also be true. Thus, we can reduce the puzzle to three cases by considering who might have been the driver:
- Curly was the truth-telling driver. So, Larry was the lookout, which means that Larry lied when he denied being the lookout, so both of his statements are false. This means that Moe's other statement is true, but he claimed that Curly shot the businessman. However, Curly was the driver, so he could not have also been the shooter. Thus, the original assumption that Curly was the driver must be false.
- Larry was the truth-telling driver. Thus, Curly was the lookout. Since Curly falsely claimed that he was the driver and Larry the lookout, he must be the liar. Thus, Moe's claim that Curly is the triggerman must be true. However, Curly was the lookout, not the shooter. So, the assumption that Larry was the driver is false.
- Therefore, Moe was the truth-telling driver and Curly shot the businessman. So, Larry lied when he falsely claimed that Curly was the lookout. Thus, Curly lied when he claimed that he was the driver, but told the truth when he said that Larry was the lookout. This is the only consistent case, which means that the D.A. should charge Curly with shooting the businessman.